

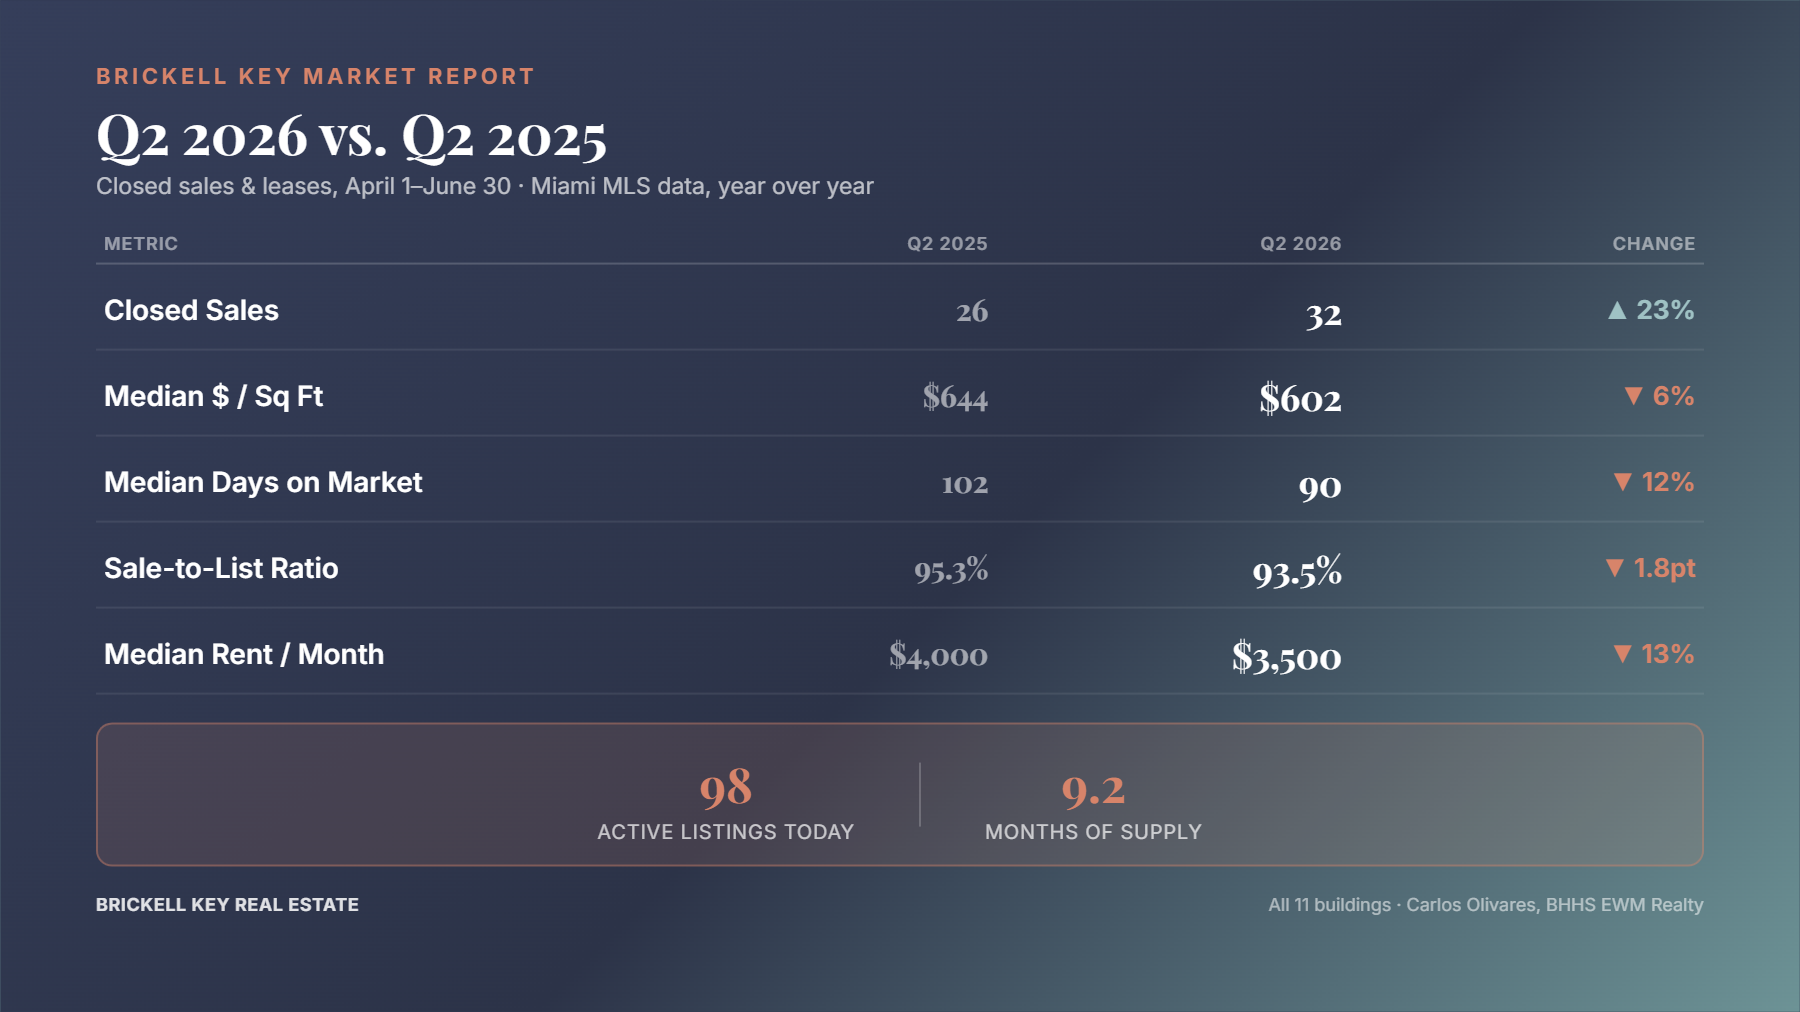
A single quarter’s numbers only tell you so much. Comparing the same quarter across two years is a better way to see whether the market is actually moving — so here’s Q2 2026 (April–June) measured against Q2 2025, using real closed transactions from Miami MLS.
More sales, faster
32 closed sales in Q2 2026, up from 26 a year ago — a 23% increase in transaction volume. Properties are moving faster too: median days on market dropped from 102 to 90.
Price: read the per-square-foot number, not the median
Median sale price fell from $824,000 to $612,500 year-over-year — a 25.7% drop that looks dramatic, but with only 26–32 sales in a quarter, the median is highly sensitive to which specific units happened to close, not necessarily what the market is actually worth. The more reliable read is median price per square foot, which fell a more modest 6.4% (from $644 to $602). That’s real softening, but nowhere near the size of the raw median swing.
The average sale-to-list ratio also eased slightly, from 95.3% to 93.5% — sellers are giving up a bit more room at the negotiating table than they were a year ago.
Rentals held flat on volume, softened on price
71 closed leases in both quarters — identical volume year-over-year. Median rent came down from $4,000 to $3,500 (-12.5%), while days on market stayed flat at 43.
Where things stand right now
There are 98 active listings on Brickell Key today. At the current pace of sales, that works out to about 9.2 months of supply — on the higher side, favoring buyers with more selection and more room to negotiate than a tighter market would allow. (This is a live snapshot as of publish date, separate from the historical Q2-vs-Q2 comparison above — check current listings for what’s actually available today.)
What this means
More transactions, faster sales, and real (if modest) per-square-foot softening — this reads as a market that’s still active but has shifted some leverage back toward buyers compared to a year ago. If you’re selling, pricing realistically from day one matters more than it did last year. If you’re buying, there’s more room to negotiate than the headlines about Miami real estate might suggest.
Methodology: figures reflect closed residential sales and leases recorded in Miami MLS for properties on Brickell Key Drive and Claughton Island Drive (all eleven buildings), comparing April 1 – June 30, 2026 to April 1 – June 30, 2025. Active listings and months-of-supply figures are a live snapshot as of publish date. All information deemed reliable but not guaranteed — verify current listings and closed comparables independently before making a decision.
Thinking about buying, selling, or renting on Brickell Key? Reach out — we’ll walk you through what these numbers mean for your specific situation.